The SLM#
Grid#
The SLM is a square of n × n pixels. slm_grid(size, n=2048) gives the coordinates X = Y of the pixels, with the
optical axis on pixel n // 2. The pitch is size/n. Give pitch instead of size when the SLM pixels matter, as for
stochastic holograms or quantization.
X, Y = fs.slm_grid(size=20e-3)  # a square of 20 mm, 2048 points
X, Y = fs.slm_grid(n=1200, pitch=8e-6)  # 1200 pixels of 8 µm
The size sets the detail at the focus and n sets the field of view, as the quickstart explains.
Intensity#
The intensity module gives the intensity that falls on the SLM, in W/m², with a given power. For a pulse, give the
peak power, peak_power(energy, duration) for a Gaussian pulse, to get the peak intensity.
function |
intensity |
|---|---|
|
Gaussian of radius |
|
uniform disk |
Field#
slm_field(intensity, phase) gives the field after the SLM, \(E = \sqrt{I}\,e^{i\phi}\), with a flat wavefront under
the phase pattern. It is in √(W/m²), so \(|E|^2\) is the intensity.
Phase patterns#
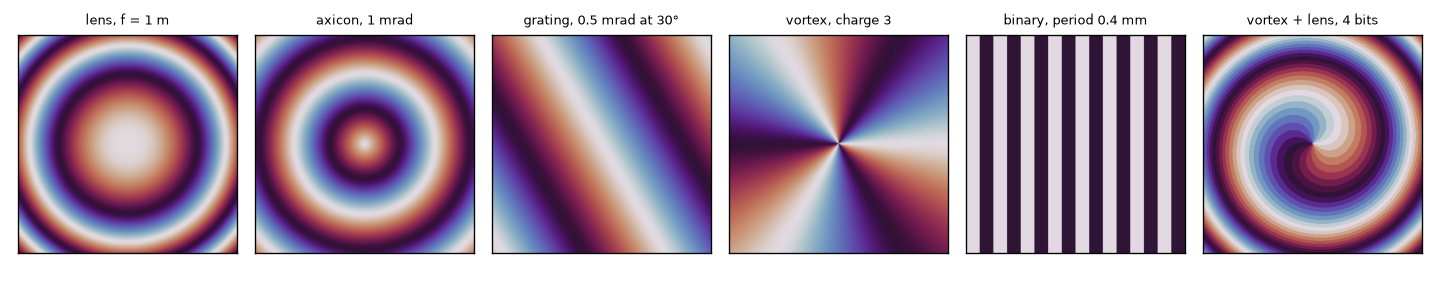
The phase module gives the phase the SLM writes on the beam. The patterns are continuous, so they add, and
slm_field puts their sum on the beam.
function |
phase |
|---|---|
|
\(-k(X^2 + Y^2)/(2f)\) |
|
\(-kR\sin\alpha\) |
|
\(k\sin\theta\,(X\cos\psi + Y\sin\psi)\) |
|
\(\ell\psi\) |
|
stripes of 0 and |
|
|
wrap brings the sum into [0, 2π) and quantize rounds it to the gray levels of the SLM, for display. Neither
changes the field, since \(e^{i\phi}\) only sees the phase modulo 2π.
import matplotlib.pyplot as plt
import numpy as np

from fourierslm import phase, slm_grid

lam = 1030e-9
X, Y = slm_grid(n=400, pitch=8e-6)
patterns = {
    "lens, f = 1 m": phase.lens(X, Y, lam, 1.0),
    "axicon, 1 mrad": phase.axicon(X, Y, lam, 1e-3),
    "grating, 0.5 mrad at 30°": phase.grating(X, Y, lam, 5e-4, np.pi / 6),
    "vortex, charge 3": phase.vortex(X, Y, 3),
    "binary, period 0.4 mm": phase.binary(X, Y, 0.4e-3),
    "vortex + lens, 4 bits": phase.quantize(phase.vortex(X, Y, 1) + phase.lens(X, Y, lam, 1.0), bits=4),
}
fig, ax = plt.subplots(1, 6, figsize=(12, 2.4))
for a, (title, p) in zip(ax, patterns.items()):
    a.imshow(phase.wrap(p), extent=[X[0] * 1e3, X[-1] * 1e3, Y[0] * 1e3, Y[-1] * 1e3], origin="lower",
             cmap="twilight", vmin=0, vmax=2 * np.pi)
    a.set(title=title, xticks=[], yticks=[])
    a.title.set_fontsize(8)
fig.tight_layout()